Building an Observability Stack on My Proxmox Homelab
$ toc
When you start running real services on your homelab, you quickly realize that flying blind is not an option. You want to know when a node is under pressure — before it starts misbehaving. This post covers how I built a full observability stack for my 3-node Proxmox cluster using Prometheus, Grafana, and node_exporter, running inside an LXC container.
By the end of this post you’ll have:
- Prometheus scraping metrics from every node in your cluster
- A Grafana dashboard showing CPU, RAM, disk, and uptime per node
- Alerts firing to Discord when something goes wrong
And more importantly, you’ll understand why each piece is there — not just how to copy-paste it.
The Stack#
Before touching a single command, it’s worth understanding what each piece does and why they’re separate.
Prometheus is a time series database with a pull model. Instead of your servers pushing metrics to a central collector, Prometheus goes and fetches them on a schedule. Every 15 seconds it makes an HTTP GET to each target’s /metrics endpoint and stores whatever it finds. This means your nodes don’t need to know where Prometheus lives — they just expose an endpoint and wait.
node_exporter is the thing that creates that /metrics endpoint on each Linux host. It reads from /proc, /sys, and /dev — the kernel’s own interfaces — and translates that data into the format Prometheus understands. CPU time, memory, disk space, network traffic: all of it, in one lightweight binary.
Grafana is the visualization layer. It connects to Prometheus as a data source and lets you build dashboards using PromQL — Prometheus’s query language. It also handles alerting, so when a metric crosses a threshold, it can notify you over Discord, email, Telegram, or dozens of other channels.
The three tools are deliberately separate. Prometheus doesn’t visualize. Grafana doesn’t store. node_exporter doesn’t decide what to do with the data. Each does one thing well.
Where to Run the Stack#
I run Prometheus and Grafana inside a single LXC container on node1 — my always-on Proxmox node — using Docker Compose. This gives me a few things:
- The stack is isolated from the host
- Everything is defined in a single
compose.yamlfile, version-controlled and reproducible - If I need to move it, I copy one directory and a compose file
The container specs are modest: 2 vCPUs, 4 GB RAM, 20 GB disk. Prometheus’s memory usage is driven by cardinality — the number of active time series — not by how much data each series holds. For a 3-node homelab with sane labels, staying under 1 GB of RAM for Prometheus is easy.
Important: node_exporter does not run in a container. It runs directly on the host it’s measuring. The reason is simple: inside an LXC, you see the container’s view of resources, not the host’s. If you want to know what node1 is actually doing, node_exporter has to run on node1 itself.
Setting Up the LXC#
pct create 120 local:vztmpl/debian-12-standard_12.7-1_amd64.tar.zst \
  --hostname mon.infra.example.com \
  --cores 2 \
  --memory 4096 \
  --swap 512 \
  --rootfs local-lvm:20 \
  --net0 name=eth0,bridge=vmbr0,ip=192.168.1.20/24,gw=192.168.1.1 \
  --nameserver 192.168.1.53 \
  --unprivileged 1 \
  --features nesting=1 \
  --onboot 1

pct start 120
pct enter 120
Two flags matter here:
--unprivileged 1: The container’s root is mapped to an unprivileged UID on the host. If something escapes the container, it lands as a nobody on the Proxmox node — not as root.--features nesting=1: Required for Docker to run inside an LXC. Without it, Docker can’t create its own namespaces and cgroups.
Then install Docker:
apt update && apt install -y ca-certificates curl gnupg
install -m 0755 -d /etc/apt/keyrings
curl -fsSL https://download.docker.com/linux/debian/gpg | gpg --dearmor -o /etc/apt/keyrings/docker.gpg
chmod a+r /etc/apt/keyrings/docker.gpg

echo "deb [arch=$(dpkg --print-architecture) signed-by=/etc/apt/keyrings/docker.gpg] \
https://download.docker.com/linux/debian $(. /etc/os-release && echo $VERSION_CODENAME) stable" \
> /etc/apt/sources.list.d/docker.list

apt update
apt install -y docker-ce docker-ce-cli containerd.io docker-compose-plugin
The Compose File#
# /opt/monitoring/compose.yaml
services:
  prometheus:
    image: prom/prometheus:latest
    container_name: prometheus
    restart: unless-stopped
    ports:
      - "9090:9090"
    volumes:
      - ./prometheus/prometheus.yml:/etc/prometheus/prometheus.yml:ro
      - prometheus_data:/prometheus
    command:
      - '--config.file=/etc/prometheus/prometheus.yml'
      - '--storage.tsdb.path=/prometheus'

  grafana:
    image: grafana/grafana:latest
    container_name: grafana
    restart: unless-stopped
    ports:
      - "3000:3000"
    volumes:
      - grafana_data:/var/lib/grafana
    depends_on:
      - prometheus

volumes:
  prometheus_data:
  grafana_data:
A few intentional decisions here:
The config file is mounted as read-only (:ro). Prometheus reads it but can’t modify it. You edit the file outside the container and reload Prometheus with a signal — more on that below.
Data lives in named Docker volumes, not bind mounts to the host. This avoids UID mapping problems that come with unprivileged LXCs: files created inside the container by the remapped root would appear owned by UID 100000 on the host, causing permission errors. Named volumes stay inside Docker’s own storage and avoid that entirely.
depends_on: prometheus tells Docker Compose to start Prometheus before Grafana. Grafana can start without Prometheus, but it’s cleaner to bring the data source up first.
Prometheus Configuration#
# /opt/monitoring/prometheus/prometheus.yml
global:
  scrape_interval: 15s
  evaluation_interval: 15s

scrape_configs:
  - job_name: 'prometheus'
    static_configs:
      - targets: ['localhost:9090']

  - job_name: 'node_exporter'
    static_configs:
      - targets: ['192.168.1.101:9100']
        labels:
          instance: 'node1'
          role: 'proxmox_node'

      - targets: ['192.168.1.102:9100']
        labels:
          instance: 'node2'
          role: 'proxmox_node'

      - targets: ['192.168.1.103:9100']
        labels:
          instance: 'pi'
          role: 'qdevice'
The first job — Prometheus scraping itself — is not just a placeholder. It’s how you verify the entire pipeline before adding any external targets. If Prometheus can see itself, the storage engine works, the scrape loop works, and the /metrics endpoint works. Only then do you add external targets, where network and firewall issues can complicate things.
Labels like instance and role travel with every data point and let you filter and group in Grafana. Keep label values from a small, fixed set — node1, node2, pi — not dynamic values like timestamps or request IDs, which would create unbounded cardinality and blow up memory.
Installing node_exporter#
Same process on every node, just different binaries:
# x86_64 (node1, node2)
wget https://github.com/prometheus/node_exporter/releases/download/v1.8.1/node_exporter-1.8.1.linux-amd64.tar.gz

# aarch64 (Raspberry Pi)
wget https://github.com/prometheus/node_exporter/releases/download/v1.8.1/node_exporter-1.8.1.linux-arm64.tar.gz
Then on each node:
useradd -r -s /sbin/nologin node_exporter
tar xzf node_exporter-*.tar.gz
cp node_exporter-*/node_exporter /usr/local/bin/
chown node_exporter:node_exporter /usr/local/bin/node_exporter
Systemd service:
# /etc/systemd/system/node_exporter.service
[Unit]
Description=Prometheus Node Exporter
After=network.target

[Service]
User=node_exporter
ExecStart=/usr/local/bin/node_exporter
Restart=on-failure
RestartSec=5

[Install]
WantedBy=multi-user.target
systemctl daemon-reload
systemctl enable --now node_exporterVerify it’s exposing metrics:
curl http://localhost:9100/metrics | head -20Reloading Prometheus Without Downtime#
When you change prometheus.yml, don’t restart the container:
docker compose kill -s SIGHUP prometheusSIGHUP tells Prometheus to re-read its config without stopping. The process keeps running, the in-memory data stays intact, and there’s no gap in your metrics. Restarting the container would cause a brief scrape gap and force Prometheus to rebuild its memory state from disk.
This is a standard Unix pattern — nginx, HAProxy, and many other services use SIGHUP as “reload config”. It’s worth knowing.
Key PromQL Queries#
CPU usage per node:
100 - (avg by(instance) (rate(node_cpu_seconds_total{mode="idle"}[1m])) * 100)node_cpu_seconds_total is a counter — it only goes up, accumulating CPU time since boot. rate() converts it to a per-second rate over the last minute, which you can read as a percentage. You never look at a counter raw; you always derive a rate from it.
RAM usage per node:
(node_memory_MemTotal_bytes - node_memory_MemAvailable_bytes) / node_memory_MemTotal_bytes * 100RAM is a gauge — it goes up and down freely, representing the current state. You read it directly. Applying rate() to a gauge would give you meaningless results: Prometheus would interpret drops in RAM as counter resets and inflate the numbers.
Disk usage per node:
100 - ((node_filesystem_avail_bytes{mountpoint="/"} / node_filesystem_size_bytes{mountpoint="/"}) * 100)Also a gauge. Also read directly.
The rule: if the metric name ends in _total, it’s a counter — use rate(). If not, it’s probably a gauge — read it as-is.
Uptime Panel#
time() - node_boot_time_secondsSet the unit to Duration (s) in Grafana and it converts automatically to “X days, Y hours”. Set the threshold color to green — any positive uptime is good, and there’s no “warning” value for uptime.
Here’s what the final Cluster Overview dashboard looks like with all three nodes being monitored:
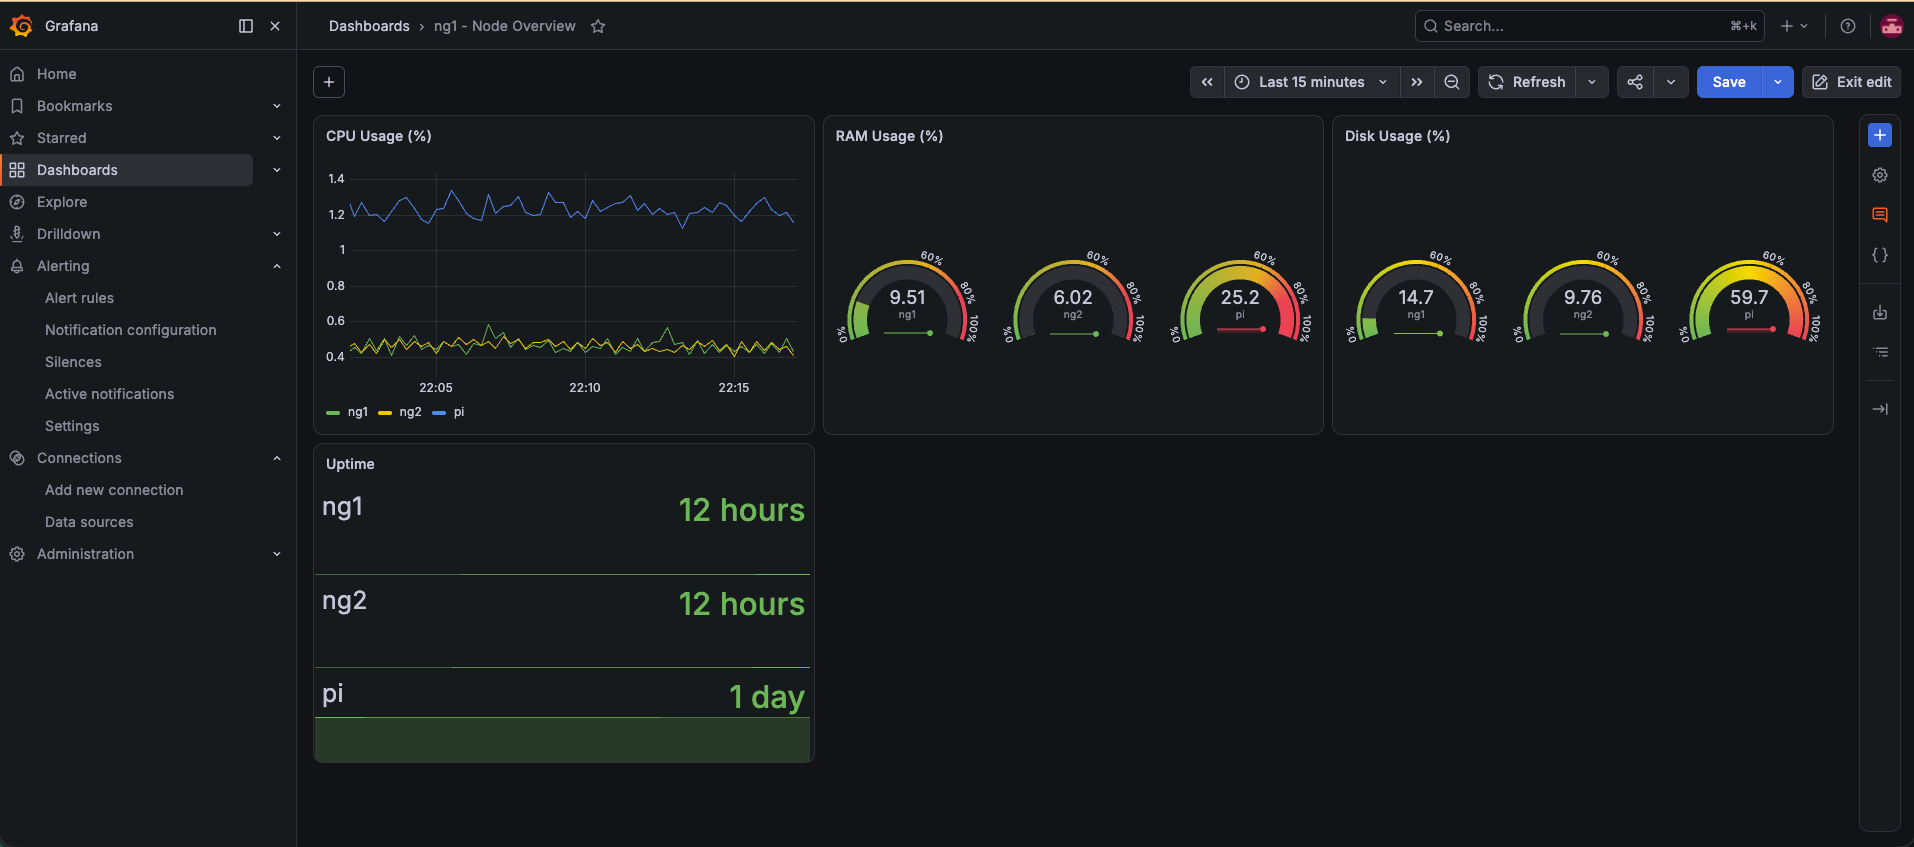
CPU usage as a time series so you can spot trends and spikes, RAM and disk as gauges with color thresholds so you know at a glance if something needs attention, and uptime as a stat panel per node. The Pi’s disk at 59.7% is the first one that will trigger the disk alert if it keeps growing.
Prometheus Targets#
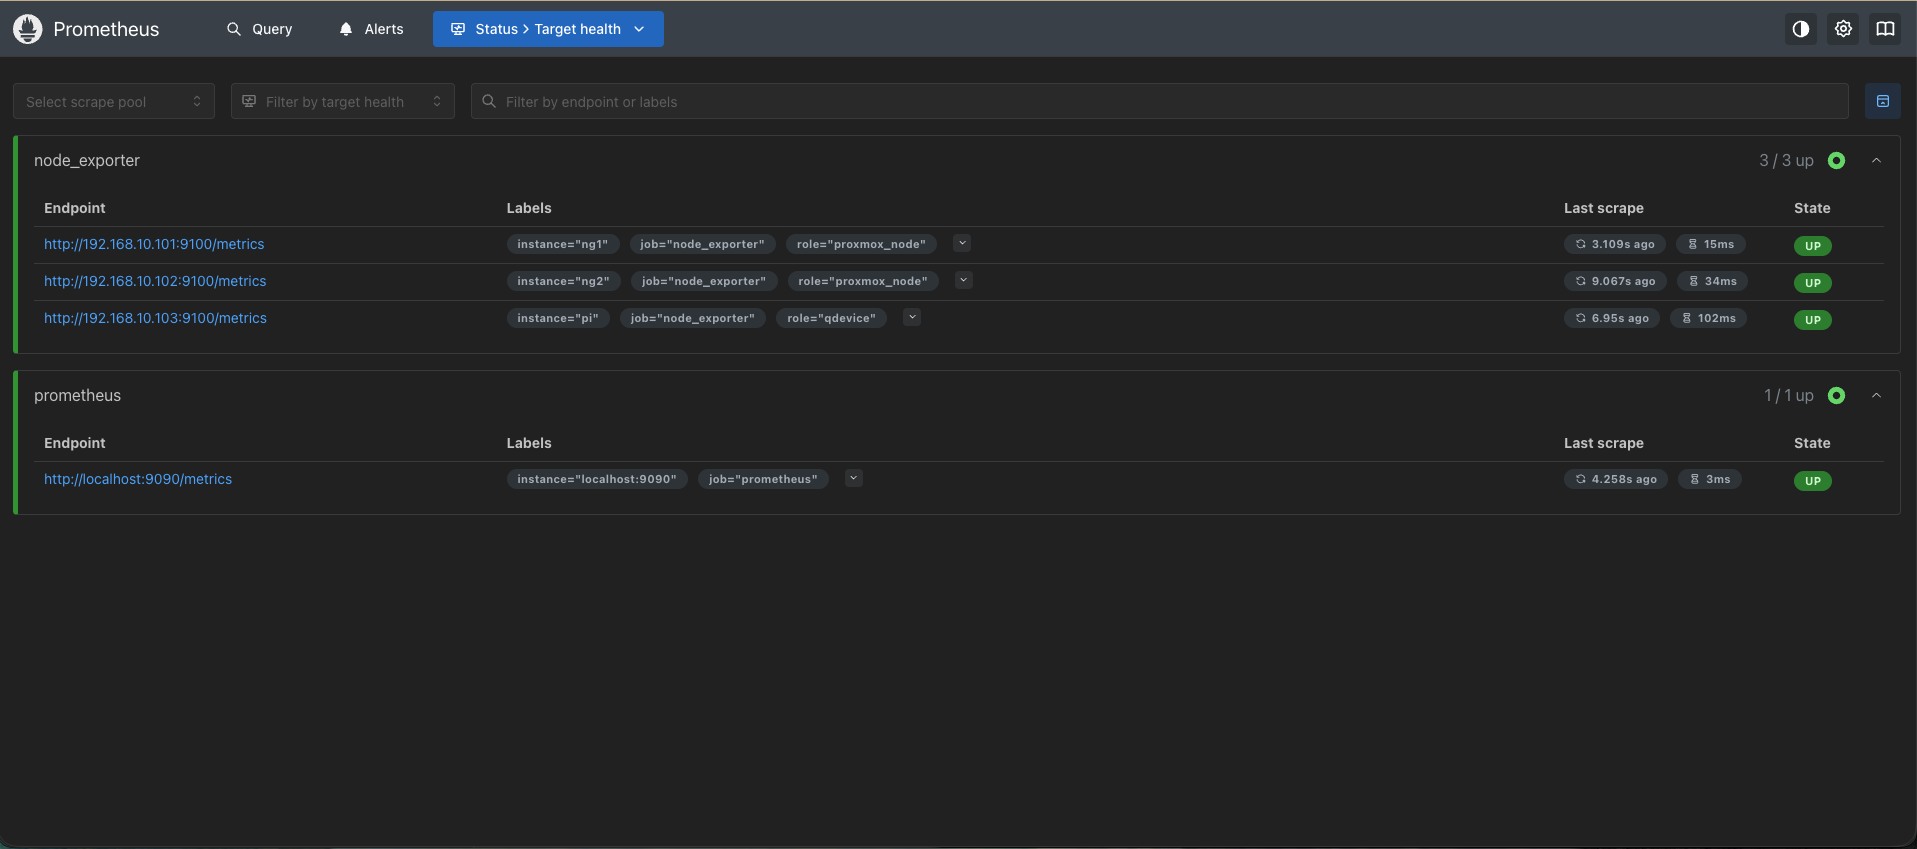
And here’s Prometheus confirming all 4 targets are up — 3 node_exporter instances plus itself:
Alerts#
Two alerts cover the most common failure modes in a homelab:
High RAM (>85% for 5 minutes):
(node_memory_MemTotal_bytes - node_memory_MemAvailable_bytes) / node_memory_MemTotal_bytes * 100Threshold: IS ABOVE 85, Pending period: 5m
High disk (>80% for 5 minutes):
100 - ((node_filesystem_avail_bytes{mountpoint="/"} / node_filesystem_size_bytes{mountpoint="/"}) * 100)Threshold: IS ABOVE 80, Pending period: 5m
The 5-minute pending period is not a delay — it’s a filter. A RAM spike during a Proxmox live migration might hit 90% for 30 seconds and resolve itself. Without the pending period, you’d get a Discord notification at 3am for a non-event. With it, you only get alerted when the condition is sustained and actually needs your attention.
Always test your alerts. Temporarily lower the threshold below your current usage, wait the pending period, and confirm the notification arrives. An alert that doesn’t fire when it should is worse than no alert at all.
Here’s what a real alert looks like in Discord — this one fired when the Pi’s disk crossed 80%, then resolved automatically after I lowered the threshold back:
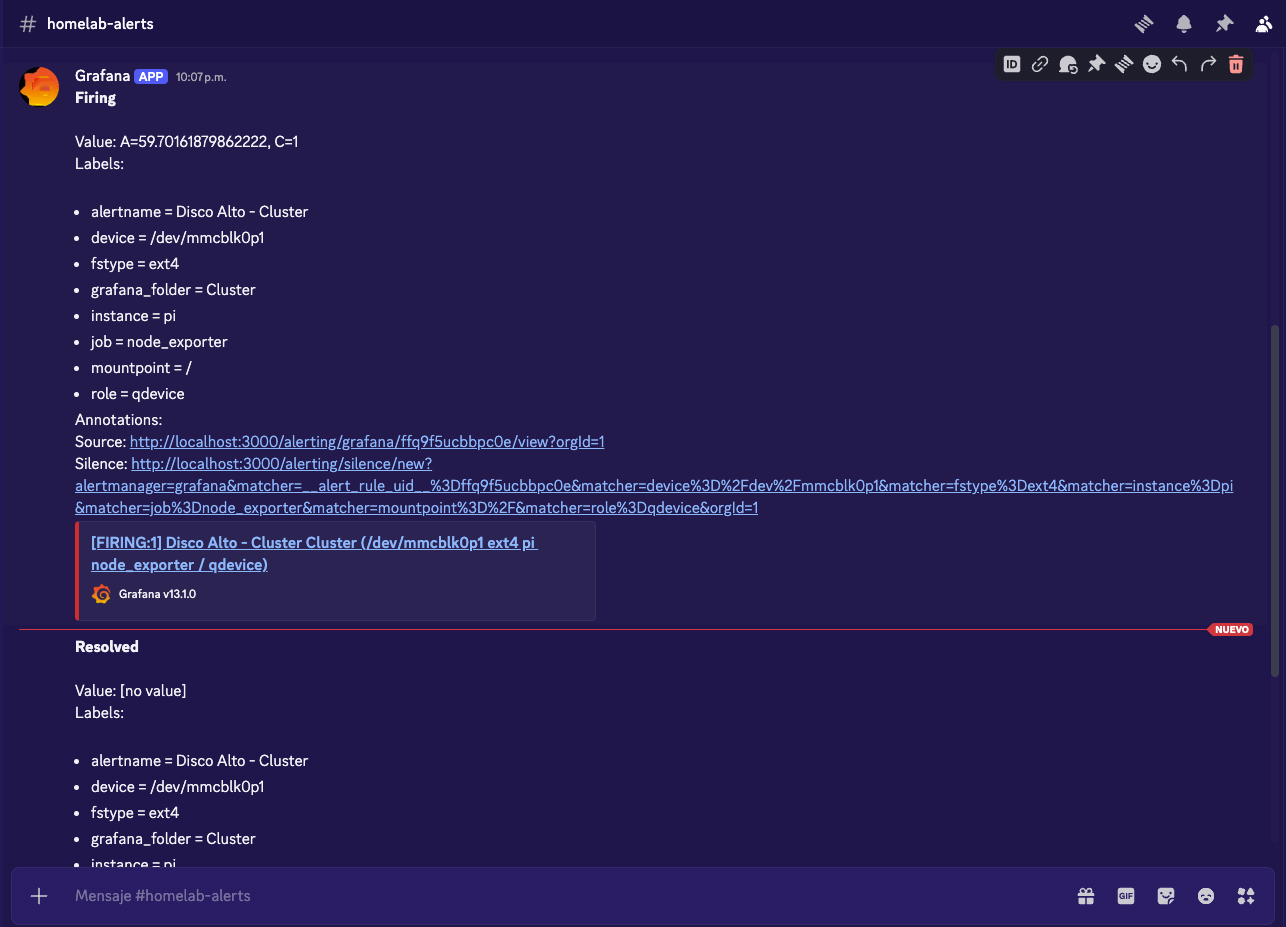
Note the Resolved message below — Grafana automatically sends a resolution notification when the condition clears. You get the full lifecycle: firing, context (which node, which device, which filesystem), and resolution. No manual cleanup needed.
What’s Next#
This stack covers the metrics layer. The next piece is logs — Loki for storage and Grafana Alloy as the collector. With both running, you can correlate a CPU spike in Grafana with the exact log line that caused it, which is where observability starts to feel genuinely powerful.
After that: Alertmanager for proper alert routing, the prometheus-pve-exporter for Proxmox-specific metrics (VM states, storage usage per pool, cluster health), and eventually self-hosting this entire stack on my own infrastructure.
The infrastructure is starting to watch itself.